When I first started looking at charts, indicators looked confusing.
There were lines everywhere.
Different colors.
Different numbers.
It didn’t feel like something I could actually use.
So at the beginning, I mostly ignored them.
I focused on news, earnings, and just whether a stock looked like it was going up or down.
That worked sometimes.
But it also led to a lot of random decisions.
This sentence needs to be rewritten in your own words I didn’t really have a clear way to decide when to enter or wait.
An indicator is basically a tool that uses past price data to help you understand what might be happening in the market.
It doesn’t predict the future.
It just shows patterns.
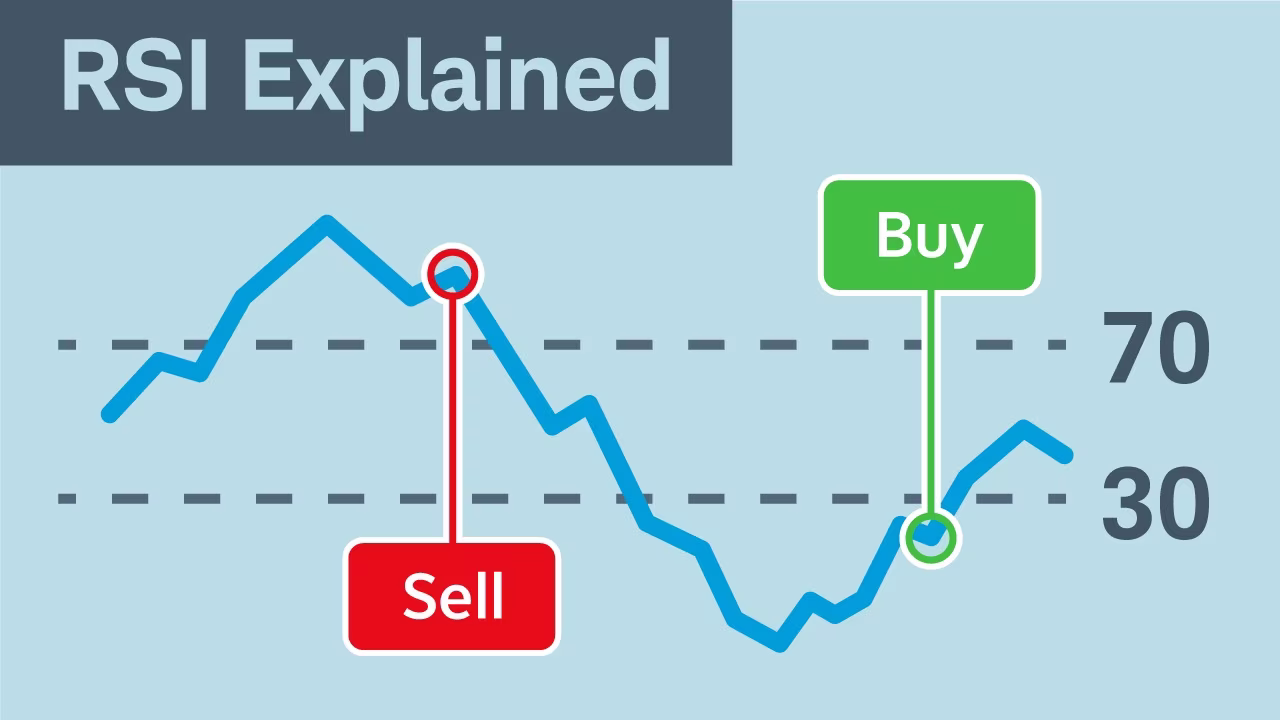
For example, RSI tells you if a stock might be overbought or oversold.
Volume shows how many shares are being traded.
At first I thought indicators would give clear answers.
Like a signal that says “buy here” or “sell here.”
But that’s not how it works.
Indicators are more like hints than instructions.
Now I use them differently.
I don’t rely on just one indicator.
And I don’t treat them as something that guarantees anything.
Instead, I use them to slow down my decisions.
If something looks like a good opportunity,
I check indicators to see if the move actually makes sense.
Sometimes they confirm what I’m thinking.
Sometimes they stop me from making a bad trade.
And honestly, that second part is more important.
Let’s watch useful video: How to Use the Relative Strength Index (RSI)
https://www.schwab.com/learn/story/how-to-use-relative-strength-index-rsi
I’m still learning how to use them properly.
But I’ve realized that indicators aren’t about being right every time.
They’re just there to help you avoid being completely random.
Why Volume Matters More Than I Thought
At first, I didn’t pay much attention to volume.
I mostly looked at price.
If a stock was going up, I assumed it was strong.
If it was going down, I assumed something was wrong.
Volume felt like extra information I didn’t really need.
That turned out to be a mistake.
I was only seeing what the price was doing, not how strong that move actually was.
One thing I started noticing was that not all price movements feel the same.
Sometimes a stock goes up slowly with barely any volume.
Other times it jumps with a huge spike in volume.
At first, both looked like “green days” to me.
But they behave very differently after.
Moves with low volume often fade quickly.
It’s like there’s no real support behind them.
But when volume increases during a move,
it feels like something more real is happening.
More people are involved.
More money is moving.
I started paying more attention to this after a trade I got wrong.
A stock I was watching looked like it was bouncing.
The price started going up again after a drop,
so I assumed the worst was over.
But I didn’t check volume.
The move had almost no strength behind it.
It reversed quickly,
and I ended up entering right before it dropped again.
That was when I realized price alone doesn’t tell the full story.
Now I look at volume as confirmation.
If a stock is moving up but volume is low, I wait.
If the price moves up and volume increases at the same time,
that’s when I start paying attention.
It doesn’t guarantee anything.
But it makes the move feel more believable.
Even now, I still forget to check sometimes.
And usually, when I do,
I notice it right after the trade goes wrong.
Maybe that’s the part I’m still trying to fix.
Leave a Reply